
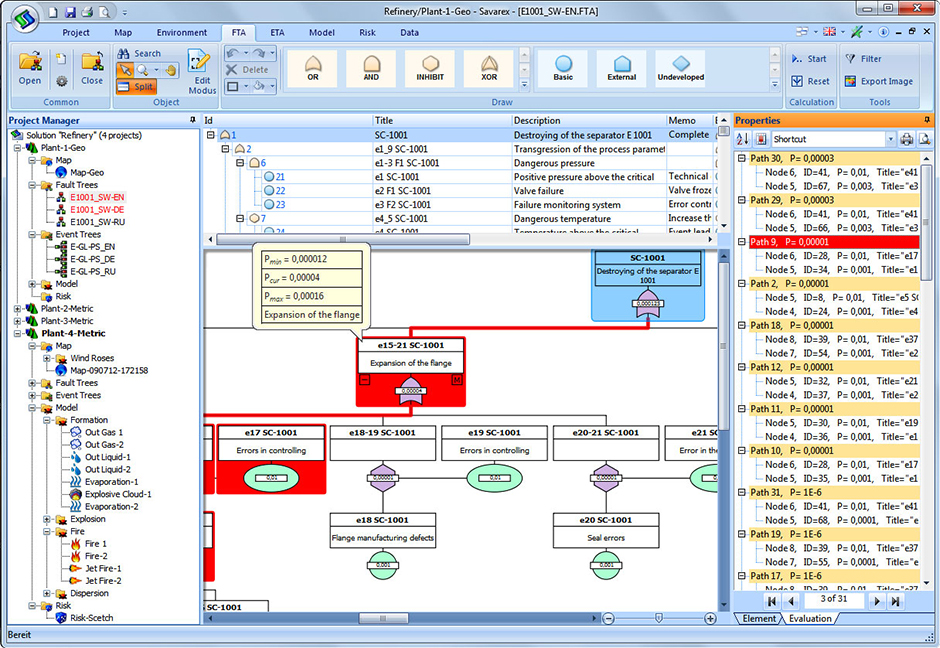
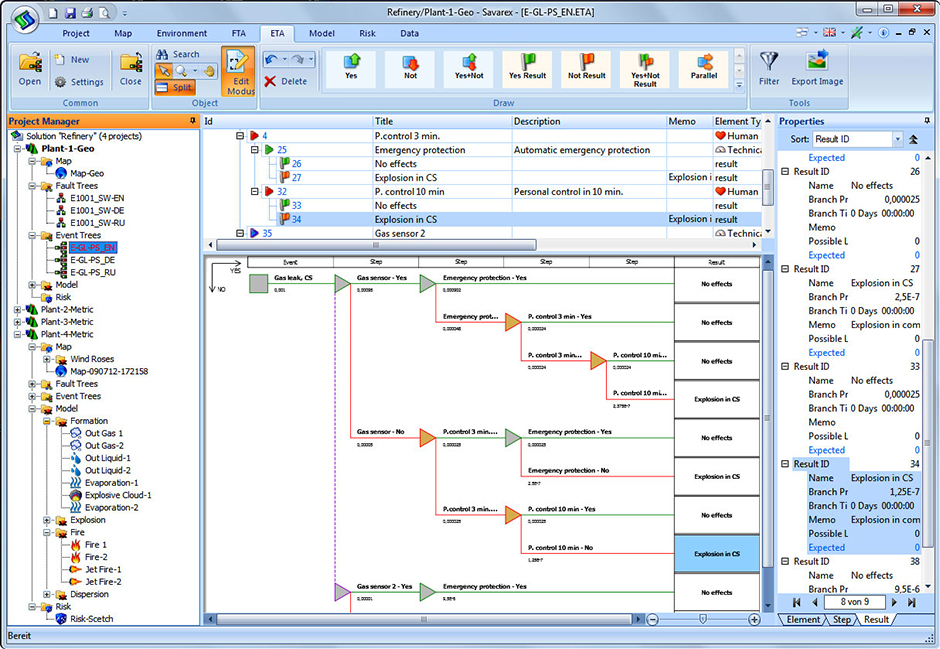
The structure of the FTA flow chart follows the operational processes. Company-specific data and values are entered. Material data is automatically proposed by the system. An integrated calculator takes care of the risk-based evaluation of the FTA. The calculation method of the evaluation can be varied via a “pull down” selection list. The default selection provides the world’s most common methods of risk calculation: Birnbaum, The “Studio” program’s ETA module checks the consequences of protective mechanisms, automatic systems and manual actions. There are three symbols for possible event types: technology, human, nature. The analysis tools are provided by the self-explanatory menu bar. The basic structure of the ETA is a YES / NO sequence. An innovation is the extended analysis of parallel events. Thus the one-dimensional approach of a YES / NO-sequence is extended to a multidimensional level. The overall effect of multiple events within an ETA gets more predictable. The presentation of the FTA and ETA is done automatically and in parallel on three levels: The document export to different formats is integrated. The hidden in Focus
Vessely,
Critical relevance coefficient,
Short cut, …
The module’s step-function documents the assumed sequence of a chain of events.
• Graphic
• List
• Data Sheet.
The project manager creates a subdirectory for “to be created” FTA (Fault-Tree-Analysis) and ETA (Event-Tree-Analysis). To edit an FTA, a menu bar with self-explanatory symbols of plant components for processes and “soft skills” as safety relevant manual actions, is available to the user.